This article shares insights from Tietoevry Create’s collaborative experience with GraphDB and its Talk to Your Graph interface, provided by Graphwise.
In today’s data-driven landscape, the ability to extract actionable insights from IoT data is no longer a luxury but a necessity for organizations aiming to maintain a competitive edge. However, many businesses, particularly in the energy sector, encounter significant hurdles in this endeavor. Complex data transformation processes, integration challenges across disparate sources, and the need for advanced technical expertise can complicate efforts to leverage IoT data effectively.
As organizations strive to harness the potential of their IoT ecosystems, they often find themselves navigating a maze of obstacles that can lead to costly delays and missed opportunities. In this post, we explore a strategic, use-case-focused approach that addresses these challenges. By examining specific applications within the energy sector such as optimizing operations in wind, solar, and hydro facilities, we at Tietoevry Create reveal insights and methodologies that can be applied across various industries.
To navigate these challenges effectively, a use-case-focused approach, combined with meticulous planning, is essential. By doing so, companies can streamline their efforts and ensure that they deliver value at every stage of the project. While this blog post showcases a specific use case in the energy sector, the principles and methodologies discussed can be applied to any industry leveraging IoT data.
Tietoevry Create journey with clients
In the energy sector, many of our clients are exploring how to efficiently harness knowledge and value from their energy parks, including wind, solar, and hydro facilities. Our goal was to identify concrete use cases and the success factors that drive these initiatives. The findings were enlightening:
| Focus area | Use case |
|---|---|
| Natural Language Processing | • The ability to extract insights and value using natural language queries. |
| Predictive Capabilities | • Predictive maintenance to preemptively address equipment issues. • Profit forecasting, balancing anticipated revenue against maintenance costs. • Strategic optimization of resource combinations to maximize profitability. |
| Enhanced Operator Support | • Streamlining access to critical information for operators to address issues swiftly. |
| Advanced Analytics | • Visualization of trends and patterns. • Correlation analysis between various operational factors. |
Path to the world for Knowledge Network
Our approach emphasized simplicity, avoiding overly complex projects laden with custom components that could escalate costs for our clients. Instead, we identified numerous opportunities to leverage existing, optimized products to demonstrate feasibility and effectiveness.
A key consideration was aligning our solutions with our clients’ long-term visions and goals. Flexibility was paramount; as new use cases emerged, the solution needed to adapt seamlessly.
We initiated a thorough analysis of the IoT data. We also realized that to satisfy the use case, we needed to enrich the IoT data with additional information, which included:
- Weather data
- Energy pricing information
- Historical maintenance records
- Maintenance manuals and instructions
- PIM
To minimize the time and effort required to move from a starting point to a tangible result, we selected smart technology that would allow us to work efficiently. The best solution we identified was using a knowledge graph on top of the data without the need to transfer it from its original storage.
GraphDB from Graphwise
Utilizing GraphDB from Graphwise, we efficiently constructed a knowledge graph, establishing semantic relationships among the data. While IoT data is not ideally suited to be stored in GraphDB due to its structure and volume, we successfully linked the semantic data with time-series data stored in a separate database.
The next step involved integrating smart services, where Generative AI played a crucial role. Our implementation included:
- Capturing user input
- Translating this input into technology specific queries via large language model (LLM)
- Generating data source queries to retrieve information from the time-series database (in this case Azure)
- Interpreting the output and delivering it back to users in their preferred format, whether as text or visualizations
GraphDB Talk to Your Graph functionality
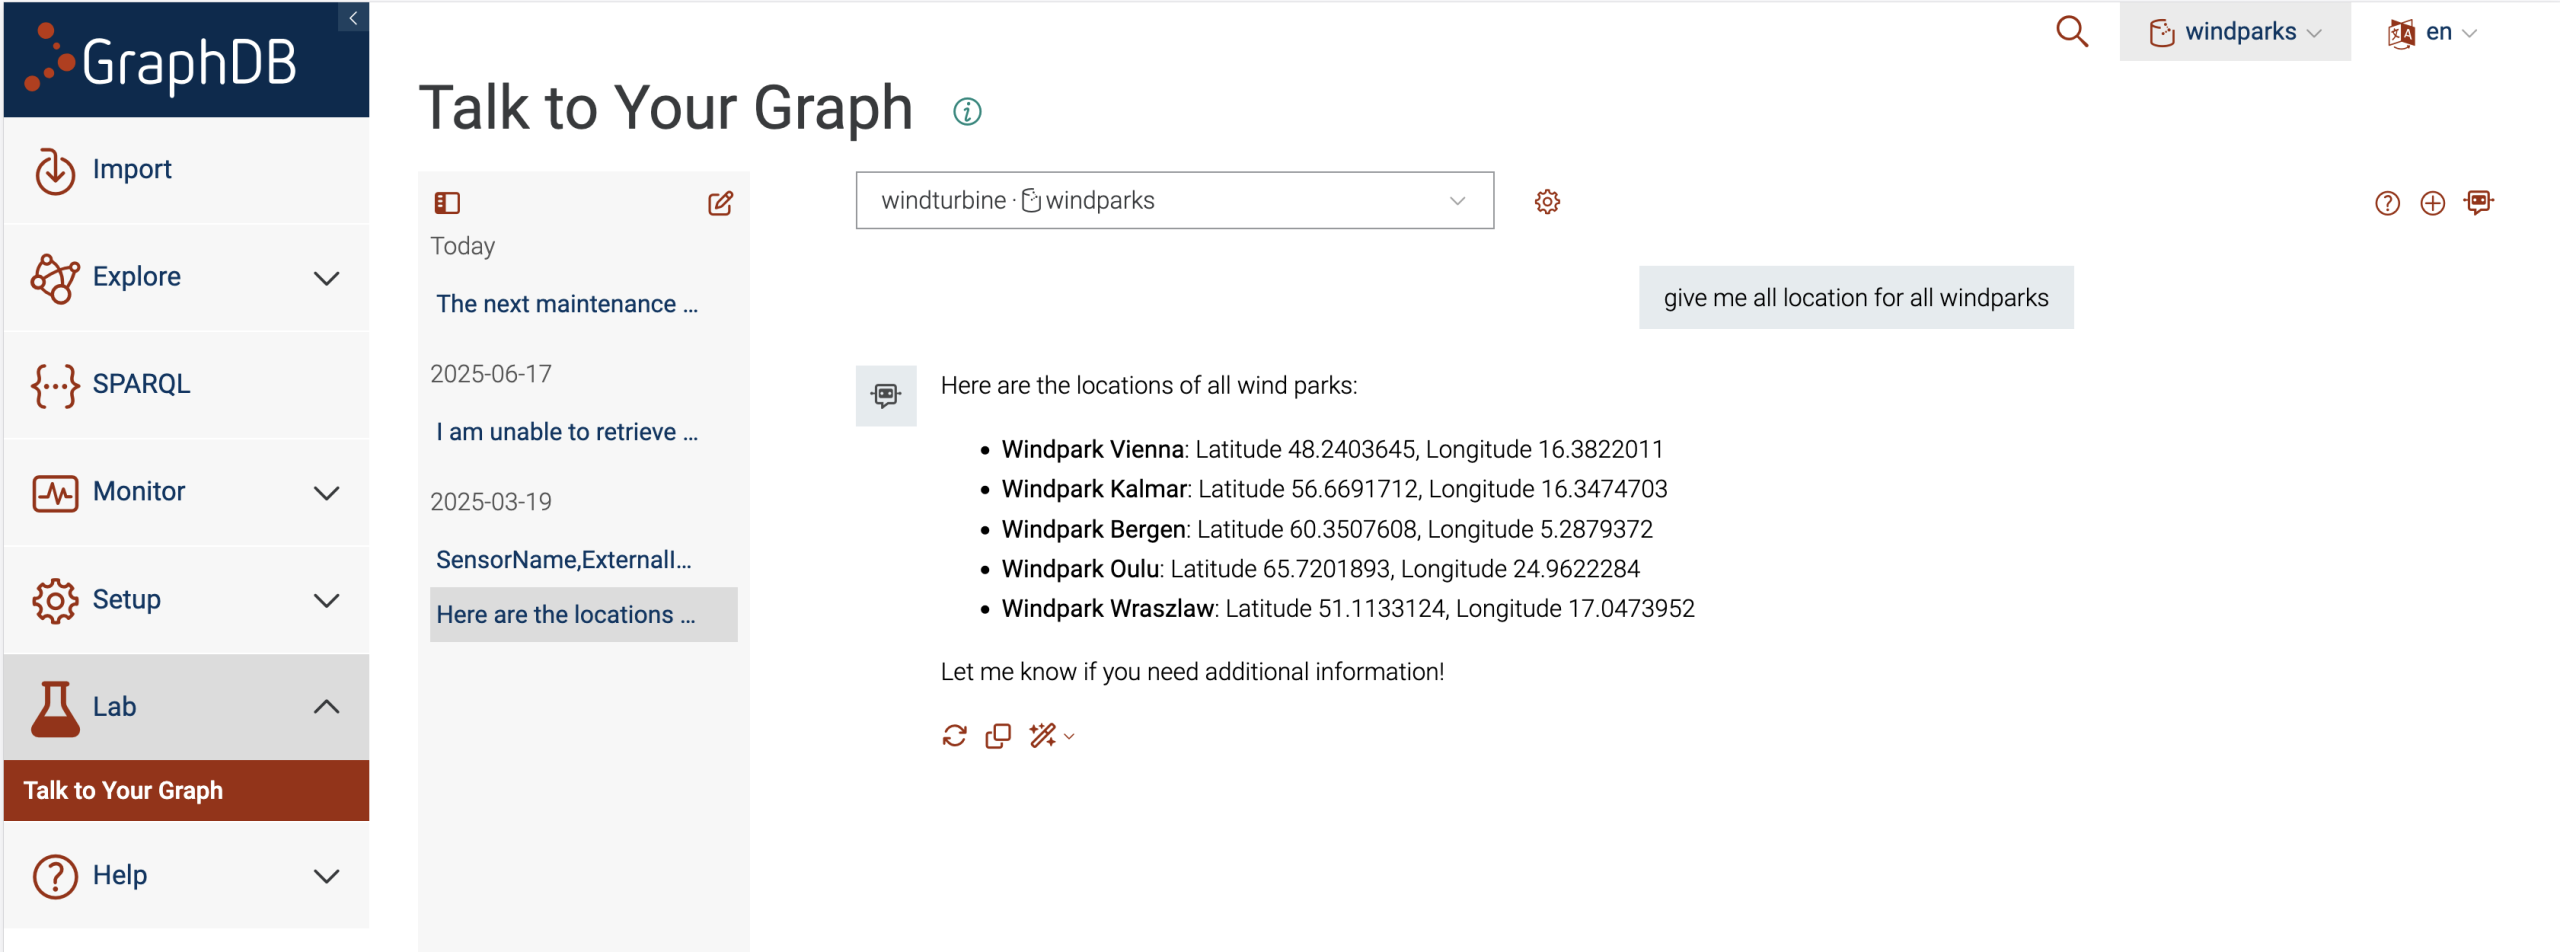
GraphDB’s built-in functionality, Talk to Your Graph, proved invaluable. This feature can be accessed directly or integrated via API, allowing us to verify use cases efficiently. By importing a partial dataset into GraphDB, we could simulate scenarios, engage clients in the process, and make necessary adjustments based on their feedback.
Recognizing additional client requirements for visualizations and operator assistance, we expanded our solution. By integrating with the Talk to Your Graph API, we could extract information and create plots and visualizations tailored to client needs.

Furthermore, we incorporated speech-to-text capabilities, enabling operators to use voice commands instead of typing, which is particularly beneficial when working in challenging environments, such as atop wind turbines. It was really easy to implement speech to text module that recognized text from voice and passed it to Talk to Your Graph API and then answers are given back to the user

Developer experience
GraphDB offers a straightforward API accompanied by comprehensive documentation, making it an accessible choice for developers. Our approach involved retaining the IoT data at its source while utilizing GraphDB as a semantic layer to enhance data accessibility and usability.
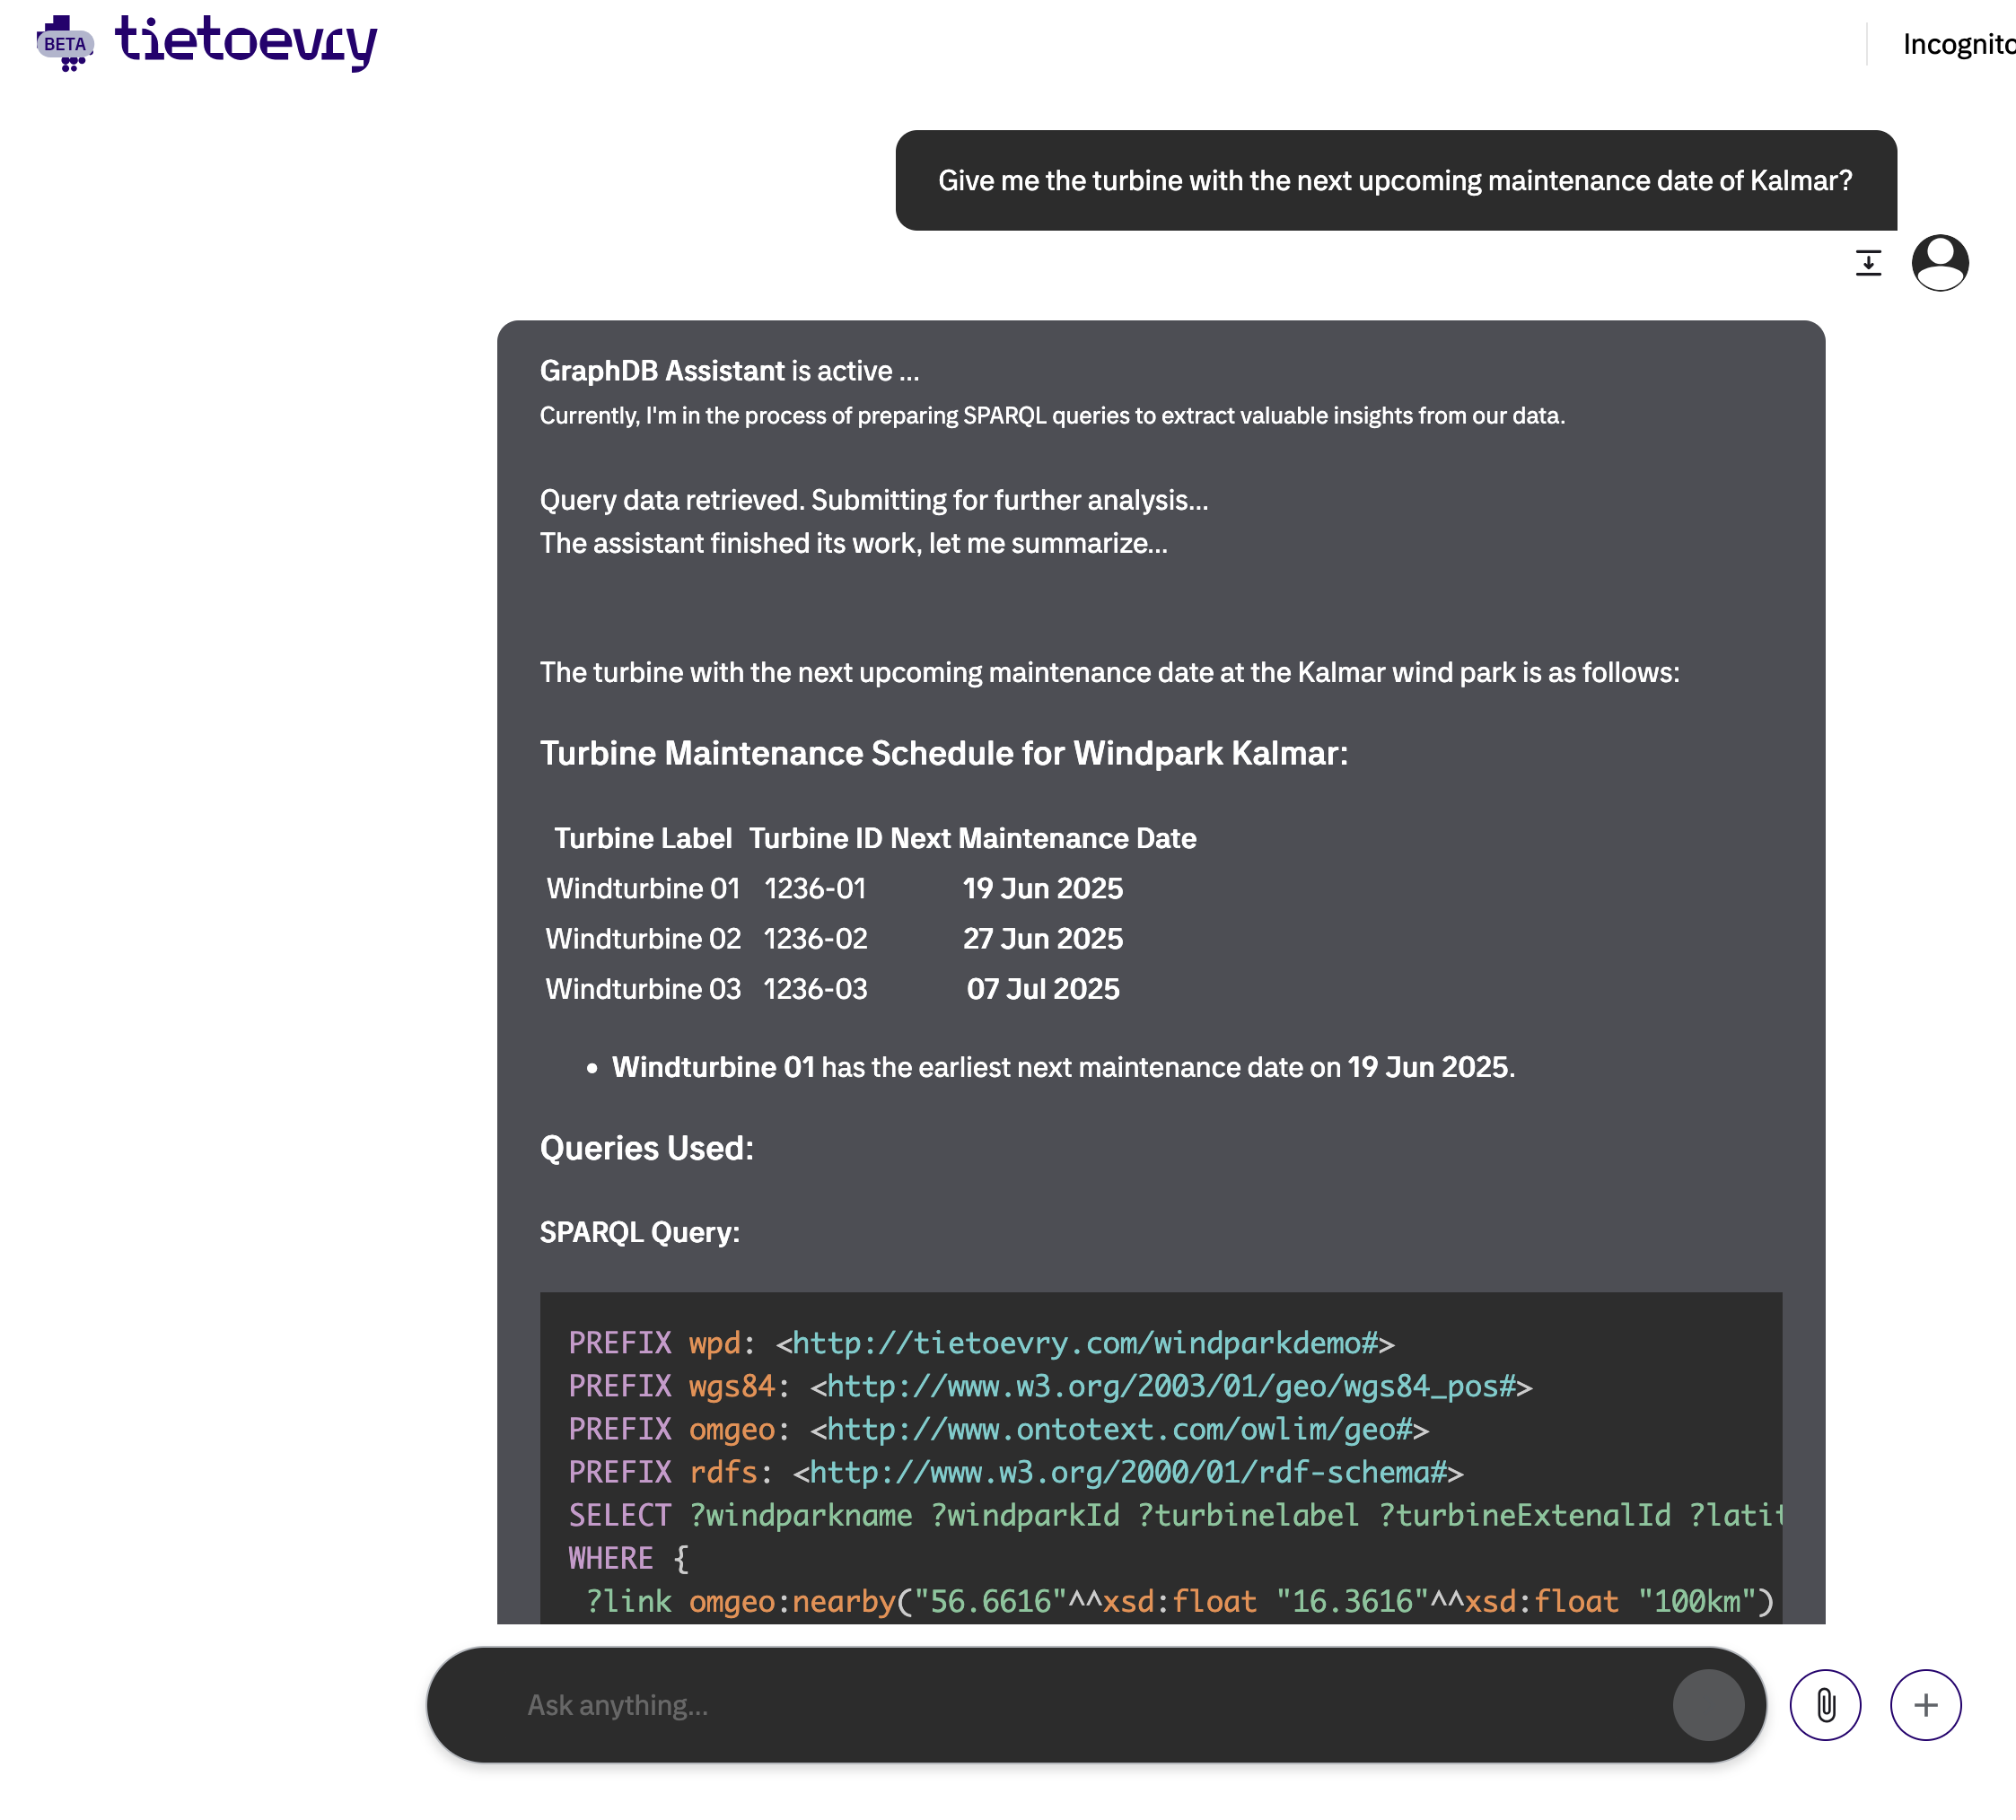
In practice, this meant that the LLM processed user input to generate SPARQL queries for data retrieval from GraphDB. The relevant information was then extracted from GraphDB, enabling the LLM to formulate queries against the time series database where the IoT data was stored.
This strategy allowed us to minimize data migration, harness the capabilities of SPARQL queries, and leverage Generative AI to seamlessly integrate and respond to user inquiries in natural language. By doing so, we ensured a more efficient and user-friendly experience while maximizing the potential of our IoT data.
As a developer, it was incredibly easy to test our model, implement changes, and make improvements directly through the “Talk to Your Graph” built-in interface. This feature allowed us to observe the behavior of changes in real-time, providing valuable insights into user interactions and enhancing the overall development process.
From natural language to insight
Post-implementation, operators can pose a variety of insightful questions, including:
Analytics
- What is the current production level for each wind turbine?
- How does the average energy price compare during peak and off-peak hours?
- What is the combined renewable energy output from wind and hydro sources?
- What factors affect turbine efficiency?
Prediction
- Based on tomorrow’s weather forecast, which energy resource should be prioritized?
- Which turbines are likely to require maintenance soon?
- What factors contribute to inefficiencies in certain turbines compared to others?
- Which turbine components should I check in inventory for upcoming maintenance?
Operator Assistance
- What parts need replacement in a turbine, and where are they located in stock?
- Can you provide instructions for changing a specific component?
- Are there any specialized tools required for component replacement?
Summary
By adopting a strategic, user-focused approach, we empower our clients in the energy sector — and beyond — to unlock the full potential of their IoT data, driving efficiency and profitability while ensuring adaptability for future challenges. The methodologies and technologies described here can be applied to various industries, enabling organizations to harness the power of IoT data effectively.
Prediction and insight revealed information in a way that our clients could take action at the right time and increase the efficiency of their powerplant and utilize the resources running it. By integrating weather data, energy pricing, and historical maintenance records, they can visualize and forecast performance. This approach shifts the focus of profitability from merely quantitative production to a more holistic view that encompasses qualitative production, ensuring that all aspects of the power plant are considered.
Integrating IoT Data for Business Value
As companies increasingly seek to extract knowledge and value from IoT data, it is essential to recognize the diversity of organizations and their unique products and services. Our experience has shown that minimizing the time required to develop a Minimum Viable Product (MVP) or Proof of Concept (POC) is crucial. Visualizing this process for clients allows them to see, understand, and assess whether the solution aligns with their needs.
To maximize value, it is imperative to integrate IoT data with other sources. For instance, combining IoT data with weather information, energy pricing, and Product Information Management (PIM) data can yield insights previously unattainable.
Conclusion: Focus on specific problems or use cases
In an era dominated by smart services and AI, it is vital to address specific problems or use cases rather than merely discussing AI in abstract terms. Vague presentations about AI can lead to time-consuming and costly endeavors for clients. Having attended the Hannover Messe and observed the advancements in IoT data solutions, it became clear that our approach to solving these challenges is unique. Many companies with similar products or solutions have not fully considered the broader implications or have focused too narrowly on niche use cases, sacrificing flexibility and adaptability for their clients.
Our objective is to create a solution that provides insights into what clients do not yet know, rather than just answering questions they already have. For example, if an operator asks, “Should I start my wind park if there are strong winds?” The answer is:
“The data reveals that higher wind speeds, indicating greater energy production, correlate with lower energy prices. This insight aligns with the economic principle that increased renewable energy generation can lead to reduced market prices due to higher supply.”
Want to try it out?


