What is a Context Graph?
Enterprise AI initiatives are increasingly constrained not by a lack of data, but a lack of usable context. A recent MIT study found that roughly 95% of generative AI pilots have no measurable impact on profit and loss, highlighting a gap between experimentation and operational value.
The cost of this gap is already visible in daily workflows — knowledge workers spend hours verifying outputs, while hallucinated responses continue to influence decisions. One response to this challenge was the adoption of knowledge graphs, which ground AI systems in structured relationships and improve retrieval accuracy.
However, traditional knowledge graphs capture what is connected, and vector databases retrieve what appears similar. Still, neither provides information about the specific situation (time, location, user behavior, or intent) that would allow for the reliable retrieval of relevant data at a given moment.
Context graphs address this limitation by capturing dynamic procedural logic and event traces, which are essential for Agentic AI to avoid “context rot” and hallucinations.
Why is a context graph needed?
A Context Graph extends the knowledge graph by adding the dimensions of time and decision lineage. While a knowledge graph knows what a customer is, a context graph captures the specific reasoning behind a decision made for that customer at a specific moment.
As we discussed regarding the high failure rates of AI agents, standard generative models and even static knowledge graphs can suffer from “context rot.” This occurs when an AI retrieves a policy or fact that used to be true but is no longer valid for the current situation, leading the agent to act on deprecated information with dangerously high confidence.
Context Graphs solve this by explicitly modeling temporal validity, causal chains of events, and authority hierarchies. They act as the Long-Term Memory (LTM) for AI agents. When an agent faces a complex task, it can query the Context Graph to see exactly how a past decision unfolded — what the inputs were, which policies were applied, why a human-in-the-loop override was triggered, and what the final outcome was.
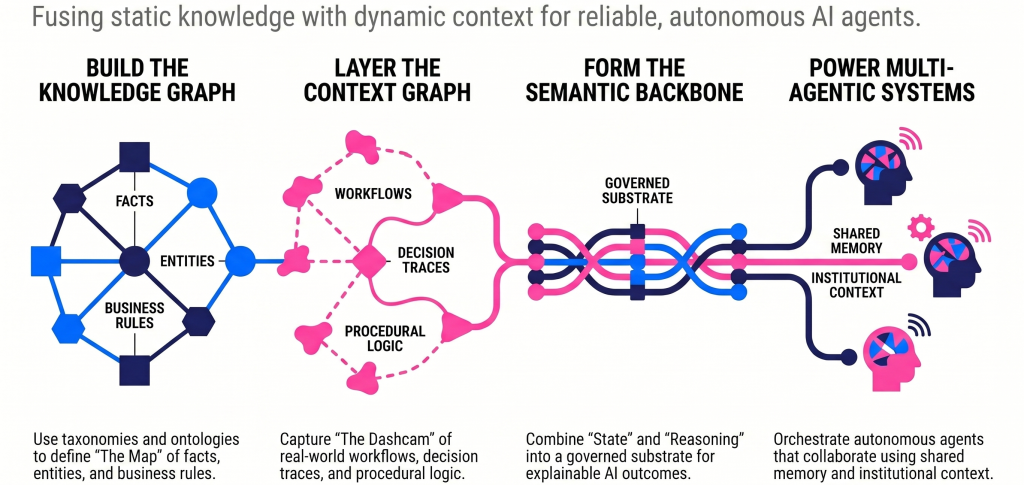
To establish a semantic backbone for autonomous multi-agent systems within organizations, knowledge graphs are supplemented with additional contextual information. This additional context is typically captured in a context graph across six dimensions. This complementary information helps agents determine whether a statement is trustworthy and whether it can be used in an operational workflow without further manual intervention.
| Dimensions | What it represents | Example |
|---|---|---|
| Temporal validity | The time period during which a statement remains accurate or applicable. | A control marked as implemented remains valid only until the next scheduled review or evidence refresh cycle. |
| Spatial scope | The organizational, system, or jurisdictional boundary within which a statement applies. | A data retention requirement applies to customer records stored in EU infrastructure but not to internal testing datasets hosted in a separate development environment. |
| Provenance | The source of a statement, such as a person, system, or external authority. | A risk rating assigned by an auditor is treated differently from one generated automatically by a scanner. |
| Confidence | The level of certainty associated with a statement, especially when information is inferred rather than verified. | An asset classification derived from automated discovery tooling carries a lower confidence level than one confirmed through configuration management records and ownership validation. |
| Governance constraints | The policies or access rules that determine who can view or rely on a statement. | Sensitive incident investigation results are visible to the security response team but restricted from general engineering dashboards until remediation is complete. |
| Decision scope | The types of decisions for which a statement is considered appropriate evidence. | Evidence accepted for internal readiness tracking may still require additional validation before it can support a formal SOC 2 audit assertion. |
Evolution of context graphs
For over a decade, the Semantic Web community has worked on the problem of adding context to knowledge graph statements. Contextualized Knowledge Repositories (CKR) are one such approach. CKRs organize multiple knowledge bases into contexts defined by attributes such as time, space, or topic. Contexts are hierarchically related, allowing knowledge to be flexibly represented and reused while ensuring that statements are interpreted only within their valid boundaries.
Enterprise interpretations have expanded this model further. An analysis by Foundation Capital describes context graphs as living, queryable maps of how organizations make decisions. In this view, decision traces and governance rules become first-class graph elements alongside entities and relationships. It provides a richer, operational representation of organizational knowledge.
For example, a policy exception and its approval history can be represented directly in the graph. Teams can then see who approved the exception and when it applies.
Context graph vs. knowledge graph
While knowledge graphs have become a common tool in enterprise data management, context graphs extend their capabilities to handle operational reality more precisely.
A context graph is best understood as an extension of a knowledge graph. Organizations can build it on top of an existing knowledge graph and enrich it with operational metadata and context layers. This approach preserves existing structures while making the graph actionable in real-world workflows.
Knowledge graphs, in conjunction with context graphs and their procedural knowledge, form the semantic backbone and thus the long-term memory of a company.
Below is a comparison of the context graph and the knowledge graph to better understand their differences.
| Aspects | Knowledge graph | Context graph |
|---|---|---|
| Core structure | Nodes and edges representing entities and relationships | Same nodes and edges, enriched with metadata about time, provenance, confidence, and access |
| Temporal awareness | Snapshot-based, facts are generally static | Every fact includes validity period, enabling point-in-time queries |
| Provenance handling | Minimal, source often implicit | Explicit source, decision trace, and creation context for each statement |
| AI grounding capability | Supports AI reasoning on connections | Supports AI reasoning grounded in procedural knowledge and policy constraints |
| Primary use case | Semantic search, virtual assistants that answer questions about topics that are mostly static | Operational decision support, compliance, workflow guidance, and context-aware AI |
A knowledge graph can answer “Who is Alice’s employer?” and return “Company X.” A context graph can answer “Who was Alice’s employer on January 15, 2026?” while also reporting that the information came from HR records, has 95% confidence, and is visible only to finance and compliance roles.
Why context graphs matter for enterprise AI
Enterprise AI often produces unreliable outputs because it lacks context. This gap forces employees to spend hours verifying AI outputs, increasing the risk of decisions based on inaccurate information. Knowledge graphs in conjunction with context graphs fill this gap by embedding key metadata directly into the graph, making AI retrieval smarter and more reliable.
In a context graph, each fact includes its source, a confidence score, and a validity period. This means AI systems don’t just retrieve information blindly. They can prioritize reliable facts and avoid outdated or uncertain data.
At an enterprise level, context graphs are often implemented as part of a semantic backbone. It is a graph-based foundation that connects business logic and data relationships, keeping different AI agents aligned as they work across the same data and workflows. The context graph adds the missing piece here by capturing how data changes over time, along with the decisions and events behind it.
For example, in a financial risk assessment workflow, one AI agent might analyze transaction patterns while another reviews customer history. Without this shared structure, each agent might interpret a “high-risk customer” differently.
With a semantic backbone built on an enterprise knowledge graph and a context graph, both agents rely on the same definitions, along with details like when the risk score was updated, what data it was based on, and how reliable it is. This leads to more consistent and trustworthy decisions.
Real-world results show the difference. In enterprise settings, GraphRAG built on contextual knowledge is over three times more accurate than standard vector-based RAG. In the medical domain, a context-aware knowledge graph–augmented RAG system achieved 81.3% accuracy in question answering, a 6.8 percentage-point gain over baseline RAG, according to Nature Scientific Reports.
Vector stores cannot perform multi-hop reasoning, preserve relational structure, or provide provenance. Similarly, standard knowledge graphs lack statement-level metadata for evidence evaluation. Context graphs add these layers of information, giving AI systems the clarity and trust they need to make better decisions.
Real-world applications across industries
Different sectors extend knowledge graphs with contextual signals such as timing, provenance, and evolving relationships. This makes graph models even more useful in operational settings where information changes frequently, and decisions depend on traceability.
Healthcare
Knowledge graphs support clinical decision support and drug discovery by connecting biomedical datasets that normally remain siloed. The Clinical Knowledge Graph integrates more than 16 million nodes and 220 million relationships from 26 biomedical databases — providing researchers with a shared structure for exploring these connections.
Financial services
Banks use graph-based models to follow relationships between regulations, controls, systems, and reporting obligations. In several global bank pilots, these graph models helped shorten compliance review cycles by about 40% by making dependencies easier to trace across teams and jurisdictions.
Media
Media organizations use semantic graph platforms to support dynamic publishing workflows. For instance, the BBC used GraphDB with SPARQL queries to integrate data across teams, players, and matches during the 2010 FIFA World Cup. This setup generated more than 800 automatically assembled pages from structured sports information.
Manufacturing
Manufacturers use graph-based supply chain models to track dependencies among suppliers, components, certifications, and logistics events. Manufacturers can use knowledge graphs to trace how a single supplier disruption affects downstream assemblies. This helps teams identify alternative sourcing paths more quickly during production interruptions. For example, if a key supplier experiences a delay, the graph can show which assemblies and finished products will be affected. This will allow teams to quickly identify alternative suppliers or adjust production schedules.
Industrial Control Systems (ICS)
Knowledge graphs help integrate scattered ICS data, connect system dependencies, and support security and operational decision-making. Research shows that knowledge graph–based models can improve situation awareness, help identify correlations, and assist engineers in making intelligent operational choices. For instance, a graph can link sensor readings, equipment maintenance records, and control rules in a power plant to help engineers spot correlations between equipment behavior and environmental conditions.
How to build a context graph
Signals from enterprise systems are connected to entities, policies, and decisions to create a structured map of operations that reflects reality and evolves as workflows change. Platforms like Graphwise provide the database and semantic modeling to turn this map into an operational context graph.
1. Collect activity signals
Data teams start by collecting activity traces across enterprise applications such as CRM systems, support tickets, chat platforms, documents, and code repositories. These signals reveal how work flows in practice instead of how processes appear in manuals. Using GraphDB, teams can store these signals as RDF statements and model metadata such as provenance, temporal validity, and confidence levels.
2. Normalize and align data
Next, they normalize the data by aligning entities across systems, reconciling identifiers, and unifying taxonomies and ontologies so the graph reflects a consistent semantic structure. A standardized semantic model enables easier integration of data across systems and AI applications.
Graphwise Graph Modeling supports this process by creating a centralized taxonomy and ontology layer built on W3C standards such as SKOS and RDF. This helps organizations define shared vocabularies, link related concepts across datasets, and maintain consistent metadata across systems.
3. Identify workflow patterns
Recurring sequences of actions form workflow patterns, revealing how teams complete tasks and where decisions occur. Graphwise can derive new relationships through semantic inference, connecting signals that aren’t explicitly linked in the source systems.
4. Filter and refine
Teams then filter or generalize low-frequency patterns to improve reliability and protect sensitive activity. This step keeps the graph focused on repeatable operational behavior instead of noise. As teams complete tasks, feedback from outcomes strengthens the model. The graph captures outcomes and uses them to refine its model.
5. Maintain an up-to-date graph
Workflows change continuously, and the graph updates as new activity is generated. GraphRAG helps ground AI outputs in the graph’s metadata to ensure that decision support and insights reflect confidence, source, and temporal context.
6. Follow standards for consistency
Standards like RDF-Star, OWL-Time, and W3C PROV-O provide consistent ways to model provenance, temporal context, and metadata across systems. This makes it easier to integrate multiple data sources and maintain the graph over time.
A real-world example of this in action is NuMedii. The company built a 7.98 billion-triple knowledge graph across 20 databases using Graphwise technology. This reduced months of biomedical research to days of automated contextual discovery.
The next step in AI-ready knowledge
Context graphs represent the evolution of knowledge graphs for AI, where provenance, temporal validity, and confidence are not optional add-ons but built into the structure of every fact. This design ensures that AI systems can make decisions using reliable, traceable, and timely information.
W3C standards like RDF-Star and PROV-O provide the foundation, but the real advantage comes from applying them consistently across the entire graph. Organizations that build context into their knowledge infrastructure from the start can reduce errors, improve decision-making, and unlock the full value of enterprise AI.
Ready to move from theory to practice?
