
7 AI Lessons Most Companies Learn Too Late
Real stories from the Graphwise AI Summit 2026 on what AI leaders do differently to succeed.

Main Takeaways
Start with a clear business problem, an owner and a full cost estimate, not a tool.
Make your content trusted, complete and understandable before AI reads it.
Model what your business deals with (like products and customers), so systems connect through one shared model.
Start with a small backbone that solves one real problem, then grow it.
Let AI draft and explain. Then let the knowledge graph decide what’s true and what’s allowed.
Make every answer provable, with checks on incoming data and a record of where each fact came from.
Plan for maintenance from day one, because data drifts long after the pilot ends.
Most companies learn the hardest lessons about AI after the budget is spent. Usually, a pilot looks promising, and the demo impresses everyone. But, suddenly, the project stalls somewhere between the test environment and real work. Only then does it become clear what was missing.
At the Graphwise AI Summit 2026, we learned a lot about what it takes to get past that point. Over two days, more than 1,500 registrants chimed in to hear from organizations that already solved their problem. They shared what worked, what failed, and what they would do differently.
We collected the seven lessons that came up again and again. The lessons build on each other, from choosing the right problem to keeping your data healthy long after the pilot ends. Each lesson links to the different sessions’ recording, so you can go deeper on the topics that matter most to you.
Lesson 1: Stop chasing tools
The unfortunate reality for most businesses is that AI is expensive and rarely pays off. Recent McKinsey research found that only about 6% of companies are “AI high performers.” What we believe sets them apart isn’t better tools but the way they use AI to rethink their work – not just how to do old things faster.
The good news is that most business leaders can (and should) start with the basics.
1. Start with the problem, not the product
Tools change every few months. Business problems change too, but far more slowly, which makes them a steadier place to start with. Without a clear problem, everything else becomes a house of cards. This is also where many leaders get stuck. They’re pitched smart solutions constantly, and those products are very often not built to work with the rest of the company’s systems. When the problem shifts, a disconnected tool loses its value, while connected knowledge can serve the next problem too.
2. Define what success looks like
Before choosing any technology, agree on the following with the real users, domain experts and engineers:
- The task: who does it, and what gets in their way.
- The baseline: how long it takes, or how well it works, today.
- The quality bar: what “good enough” means.
- Create a small pilot that tests the riskiest assumption.
An example is building an accurate sales proposal in an hour instead of a week. The goal is not to map every business capability. It is to start with one case and expand only to what it touches.
3. Count all the costs
Business cases usually consider only the technology price – licenses, seat fees, etc. What gets left out is the cost of changing how people work: new workflows, updated procedures, training, and the learning curve.
This is important because a project is only ready to launch when the people and processes around it are ready too, not just the model. These people’s costs are the first to stall a project once it leaves the pilot and must be considered.
4. Give the business case a real owner
The owner, who is accountable for the results, should understand the business both strategically and operationally. This person is often neither IT nor a domain expert. IT tends to focus on how to build the solution, while domain experts know the day-to-day work but not always the bigger picture. That’s why projects often fail when they’re handed to an implementation team that doesn’t understand the business problem, especially when leadership steps back.
Moreover, during our panel live poll, “unclear” was the second most common answer to who owns the AI business case. Thankfully, our session with EY explained how the split can work. Business teams come with the agent they want and build the ROI case themselves, and IT picks the technology. The business owns the data, while IT owns access and governance.
There’s much more to it than fits in this blog:
▶ Watch the full business-case panel to hear how to build an AI business case that lasts.
▶ Watch the energy panel to hear why educating your organization beats buying another tool.
▶ Watch the EY session to see how business and IT split ownership.
Lesson 2: Get your content right before you add AI
AI models keep getting better, so most companies no longer struggle to find the right model. They struggle with their data. The problem is easy to miss because pilots usually run on clean, hand-picked data and seem to work. Production data is different because it’s messy, so AI will just repeat it across all systems.`
“Building a shiny agent usually takes one or two days… Fixing the enterprise ecosystem usually takes years”
Vassil Momtchev
SVP Product & Technology, Graphwise
So what does “getting your content right” actually mean? Our sessions point to three qualities your content needs before AI can use it: it must be trusted, complete, and understandable.
1. Trusted data – decide what the AI is allowed to read
You should first question which content AI should read at all. During the session with EY, we explored that they first define a “golden source” with sanctioned and true content. Only that content was moved onto one platform and made AI-ready with a taxonomy, ontology, and knowledge graph. The hard part, however, was getting every team to agree on terminology, since different teams used different names for the same things.
In our Graphwise Platform session, we explained that most hallucinations come from poor grounding, not a bad model. In the session’s live poll, 40% of attendees named data infrastructure as the biggest bottleneck between pilot and production.
2. Complete data – check, before the AI uses it
Trusted content can still be thin. Our Avalara session showed what to do about that. Its agents draft entire user guides from source material, but they won’t start until that material passes a quality check. Agents score it against a long list of questions. If it falls short, the process stops and goes back to the experts instead of letting AI fill the gaps with guesses.
3. Understandable data – write down what it means
Even trusted, complete content fails if a machine can’t tell what it means. However, people can fill those gaps with their own expertise, but AI can’t. Our S&P Global session explained that its customers are shifting from analysts to machines, so it now writes meaning down next to the data. This is called semantic metadata, and they add it at two levels:
- Column level: what each column holds, such as “steel exports, in tonnes.”
- Value level: what each value means, linked to one standard ID, such as “this value is France.”
Without these labels, ten teams can define a “product” in ten different ways.
S&P Global uses a simple rule to test the result. Data is AI-ready only when it’s governed at source, semantically defined, easy for an agent to find, and traceable back to its source.
There’s much more to it than fits in this blog:
▶ Watch the Graphwise platform session to see why most hallucinations start with the data.
▶ Watch the EY session to see how a golden source is built.
▶ Watch the Avalara session to see how inputs are checked before AI writes a word.
▶ Watch the S&P Global session to see how semantic metadata makes data AI-ready.
Lesson 3: Model the business, not the systems
In lesson 2 we learned that our data must be trustworthy. In this one we will learn how to make it connected. This is important because you can have numerous clean, well-labelled databases and still be unable to answer a simple question because the answer might be in more than one database.
Our mobility panel brought together two organizations facing the same problem: the EU Agency for Railways (ERA) and Doppelmayr. Both described what the panel called the “interoperability tax.” That’s the extra cost of having two systems that can’t easily share information. In this lesson, we’ll look at how the ERA solved it.
The problem
ERA ran around fifteen separate databases, covering vehicle types, registrations, infrastructure, and more. Each had its own application, budget, and team. Every report that needed data from more than one database meant another custom connection had to be built and maintained. Even a simple question, such as “Where in Europe a vehicle X can run”, had no easy answer, because the vehicle data and the track data sat in separate databases.
The solution
Instead of connecting database to database, the agency described the railway itself in one shared model – an ontology covering vehicle types, infrastructure, and the rules that link them. The databases now connect to that model rather than to each other.
The difference is shown in reporting. An EU-wide analysis that used to take the agency’s data team about six months for 10 parameters now covers 300 parameters in one week. And because the ontology is now part of EU regulation, the rules live in the same graph as the data, so checking compliance means running a query that anyone can audit.
In a nutshell
Start with one question your silos can’t answer. The agency’s first pilot proved a single query could answer ‘Where can this vehicle run?’”
Model what your business deals with. The agency modelled vehicles and tracks, which exist no matter which database stores them.
Expect disagreement, because that’s the point. Agreeing on definitions showed that different engineers use different definitions for the same thing. This is a great starting point to figure out inconsistencies.
Meet non-technical colleagues where they work. The agency never shows managers the query code. It publishes ready-made queries as “data stories” and exports results as CSV files for experts who work in Excel.
For technical teams, keep the model open, and put the rules in validation. The agency defines its classes loosely in OWL and puts legal requirements into SHACL shapes that validate incoming data. This avoids running a reasoner over millions of triples, and lets a dataset be declared compliant with a specific version of the ontology. Because it all follows open standards, it works in any graph database.
There’s much more to it than fits in this blog:
▶ Watch the full mobility panel to hear both stories.
Lesson 4: Start small, then grow
After Lessons 2 and 3, a semantic backbone can start to sound like a multi-year program. Our session with ASHA showed it doesn’t have to be.
ASHA, the American Speech-Language-Hearing Association, partnered with Enterprise Knowledge to build a minimum viable backbone, which is the smallest version that solves one real problem, using real content.
The problem
ASHA publishes a large amount of content for audiologists and speech-language pathologists, like clinical resources, courses, events, journal articles, and more. That content was spread across separate websites and platforms, each structured differently, with no shared way to search across them.
This cost ASHA in three ways. Members couldn’t find resources made for them. Staff couldn’t see which topics people cared about or where coverage was missing, so teams sometimes published duplicates. And early AI experiments showed that a specialized field needs precise language, especially where content touches patient care.
The solution
ASHA designed a backbone that could one day cover all its content, but it built only a small slice first. It connected one content management system, which still powered several websites. It kept just a handful of metadata fields, used one taxonomy for topics, and added only a little ontology to improve auto-tagging. All of it served one use case – reporting and analytics.
Content from that system is now standardized, auto-tagged with topics, and stored in one central catalog.
“The main kind of focus and lesson of this project is that you don’t need these to be super complex. You don’t need to start with everything.”
Ben Kass,
Technical Consultant Taxonomy/Ontology, Enterprise Knowledge
The core build took nine months, which is fast for an association. For the first time, ASHA is set up to see its whole content portfolio in one place, combined with engagement data in dashboards. The goal is for teams to see what exists, where the gaps are, what performs well, and what needs retiring. And because the design was built to grow, ASHA is now adding more source systems without starting over.
In a nutshell
Size your taxonomy to the common middle. Don’t let your largest or most detailed content set the depth. Choose the level of detail most of your content shares, so you can compare topics across everything you publish.
Build small ontologies, each answering one question. Write down the questions you need answered first, then model only what each one needs. ASHA calls this TOAST: Tiny Ontologies All Strung Together.
Build so it can grow, but fill only what you need now. Set up your metadata and taxonomy so more content can plug in later, but model only what your first use case needs. ASHA’s first ontology tried to cover everything that might be useful someday, and the team had to scale it back.
Keep checking the size. Keep asking what problem you’re solving and how much detail you really need. Your backbone may never need to be big, and that’s fine.
“Our main point is simply that a small backbone here has had a big impact and will continue to have a big impact.”
Monica Fulvio
Taxonomist/Ontologist, ASHA
There’s much more to it than fits in this blog:
▶ Watch the full ASHA session to see how the catalog came together.
Lesson 5: Let AI explore and the graph decide
If you’ve made it this far, congratulations. You know that your content should be trusted, connected, and ready. Now comes the fun part – putting AI to work on top of it.
This lesson combines a few sessions that showed how that works in practice. These aren’t steps so much as ideas that build on each other.
You need both AI and knowledge graphs
The central message of our Day 1 keynote was that you should use large language models (LLMs) and knowledge graphs together, because each one solves a different part of the problem.
LLMs are brilliant with language, but they are probabilistic and can hallucinate. They generate the most likely text based on patterns, so they can sound confident and still be wrong. That’s a real risk with sensitive information. A model can give a convincing answer to a compliance question while using an outdated rule or inventing a reference. For example, in Healthcare, it could mean using the wrong treatment guidance, which can be dangerous for patients.
That’s why you need a knowledge graph that is deterministic. They make entities, relationships, and business rules explicit, so the same question gets the same answer every time, and you can see the path and the sources behind it.
Together, they cover each other’s gaps. The model is the friendly interface that copes with the information, and the graph is the semantic backbone that holds what your organization knows.
Our keynote’s advice was to put the 10–20% of data and logic that matters most into the graph and let the model handle the rest. Because the graph stores a fact once instead of working it out for every question, that split also saves money. In one showcase, it used 54 times fewer tokens.
Let AI draft and the graph find
Our Avalara session showed this split in production. Due to the high demand to write documentation, Avalara used LLMs to draft entire user guides, and reviewers kept roughly 80% of each draft.
The real problem was with updating existing documents. A small product update might change one short paragraph hidden somewhere in 10,000 documents. Handing that job to LLMs resulted in four hours to just parse a single 500-page guide, and the token budget was gone after 48 hours of testing. Standard RAG was no better.
“[Naive RAG models] tear everything up, like taking a book and cutting it into strips and putting it in a big bucket.”
Michael Iantosca
Senior Director of Content Platforms and Knowledge Engineering, Avalara
Worse, every method pointed to a different set of pages. And when the model was given a page to fix, it also changed parts it was never supposed to touch.
The breakthrough came from something Avalara already had. Its documentation is written in DITA, a structured XML format built for technical content, and DITA’s own schema became the ontology. Every topic, link, and piece of metadata was mapped into a knowledge graph automatically, and the graph refreshes every night. Now it finds the exact topics that need updating in seconds, without spending a single token. Only then does the model step in to edit that one small piece.
Give agents the right context, not longer prompts
Things get more serious when AI stops answering and starts acting. As our Accenture session explained, an agent can have access to the right data and tools and still make an unsafe decision. To act safely, AI needs to understand how things are related, the current situation, the policies that apply, who has authority, and what evidence supports the action.
If your foundations are solid, the fix isn’t stuffing more text into the prompt. No prompt can make a model know the intricate business context and relationships. Accenture builds that context in a semantic layer instead. The definitions live in a taxonomy and ontology, the relationships live in a knowledge graph, and agents reach both only through secure APIs that check who is asking and what they’re allowed to see.
The practical lesson is to give an agent a governed way to ask before you give it more freedom to act. Decide what it needs to know, what it’s allowed to see, and who is the human in the loop that approves its decisions. Then build that into the system, not the prompt.
There’s much more to it than fits in this blog:
▶ Watch the Day 1 keynote to see the full case for combining LLMs and knowledge graphs.
▶ Watch the Accenture session to see how their semantic layer works in practice.
▶ Watch the full Avalara session to see how they did it in practice.
Lesson 6: Make your AI show its work
In Lesson 5, the knowledge graph became the part of the system that decides what is true. But deciding isn’t the same as proving. Sooner or later, someone looks at an answer and asks, “How do you know?”
Our Cognizone session tries to answer this by using a fictional example of a research hub that collects funding records from agencies. Its AI assistant is asked how many quantum computing projects were funded in the last five years, and it answers 47.
But how do they know?
To explain it better, Cognizone showcased a small demo. They created a made-up database of about 300 research projects and asked the same question in two ways, with the same AI model both times. The first method, vector search, looks for text that resembles the question. The second, GraphRAG, uses a knowledge graph to follow how the data is connected.
Vector search answered 22. In 2023, the topic “quantum computing” had been split into two new topics, and the search missed every project filed under the new names. GraphRAG followed that change and answered 47 confirmed projects, plus five more waiting for review.
Those five records were caught by what Cognizone calls a gate – a set of rules that checks every new batch of data as it comes in. In the test, 52 new records arrived. Of those, 47 passed, and five failed because their end date was missing. Instead of disappearing without a trace, they went to a person for review. Every record that passed also got a stamp, known as provenance, showing where it came from, when it arrived, and which rules checked it.
The same gate applies to AI. When it suggests new data, its suggestions go through the same rules and are marked as machine-written. If the model is unsure, the suggestion goes to a person for a check. That’s how you get the speed of AI with the judgment of a human.
“Provenance is nearly free when data is created and nearly impossible to reconstruct later. Recorded at the start, it costs cents. Rebuilt afterwards, it costs a fortune.”
Agis Papantoniou
VP of Business Development, Cognizone
In a nutshell
Trustworthy AI comes from traceable data. Cognizone describes this as a building with five floors, where each floor rests on the one below it. Many vendors sell the top floor, but most companies are still on floor two. Answer one question per floor, starting at the bottom. The first “no” shows where to begin.
1. Identify: Does each real-world thing exist only once in your data? If “University of Liège” is spelled three ways, the system sees three institutions.
2. Describe: Does your data keep the meaning of relationships? “Coordinated a project” and “took part in a project” are different, and flattening both into “involved” loses that.
3. Govern: Can you say where any number came from? Did your last data load reject anything, and was anyone told?
4. Consume: Ask a multi-step question. Does the system follow your data’s connections or piece together whatever text it finds? Does every answer still carry its source?
5. Co-build: Can you tell which facts were written by a machine, and do they pass the same checks as everything else?
There’s much more to it than fits in this blog:
▶ Watch the full Cognizone session to see the gate and the demo in action.
Lesson 7: Your data needs maintenance after the pilot
Imagine you’ve followed every lesson so far. You started with a clear business problem, got your content right, modeled your business, and built a backbone that can prove its answers. Then, two years later, parts of it stopped working. How did that happen?
That’s what our energy panel warned about.
AI Technologies, which works with power grid operators, described grid data that had been left without maintenance for almost two years. The data changes by less than 0.1% a day, but those changes add up. In some cases, 30% of the data mappings built on shared data models became unusable. As a result, the applications and AI that rely on that data become brittle.
“Like everything else you use in your life, whether it’s a house, or a car. If you want to keep it, you have to maintain it. The same applies to data.”
Antun Kraljević
Technical Director, AI Technologies
Why maintenance gets skipped
Three things came up at the panel. The first is focus. Statnett, Norway’s grid operator, admitted that for years its engineers cared more about building systems than about the information inside them.
As a result, finding data took too long, there were several versions of the same thing, and every team passed a slightly different copy on to the next. Statnett’s way out started with a data catalog that shows where data lives and who is responsible for it.
The second is speed. Once a pilot works, people rush to the next use case, and the upkeep falls behind.
The third is that the payoff takes time. Statnett exchanges network data with its European partners through CIM, a common information model that has been in development for almost 20 years. Only recently have compatible applications appeared, and that’s when management saw how much time and money it saves. When results take that long to show, upkeep is easy to push down the list.
How AstraZeneca keeps a growing backbone healthy
Maintenance gets harder as more teams join in. But that shouldn’t be a reason to ignore the problem.
“No one who built a data lake aimed to have a data swamp. No one who’s done data mesh has aimed to have a data mess.”
Ben Gardner
R&D Lead for Data Mesh and Semantic Infrastructure, AstraZeneca
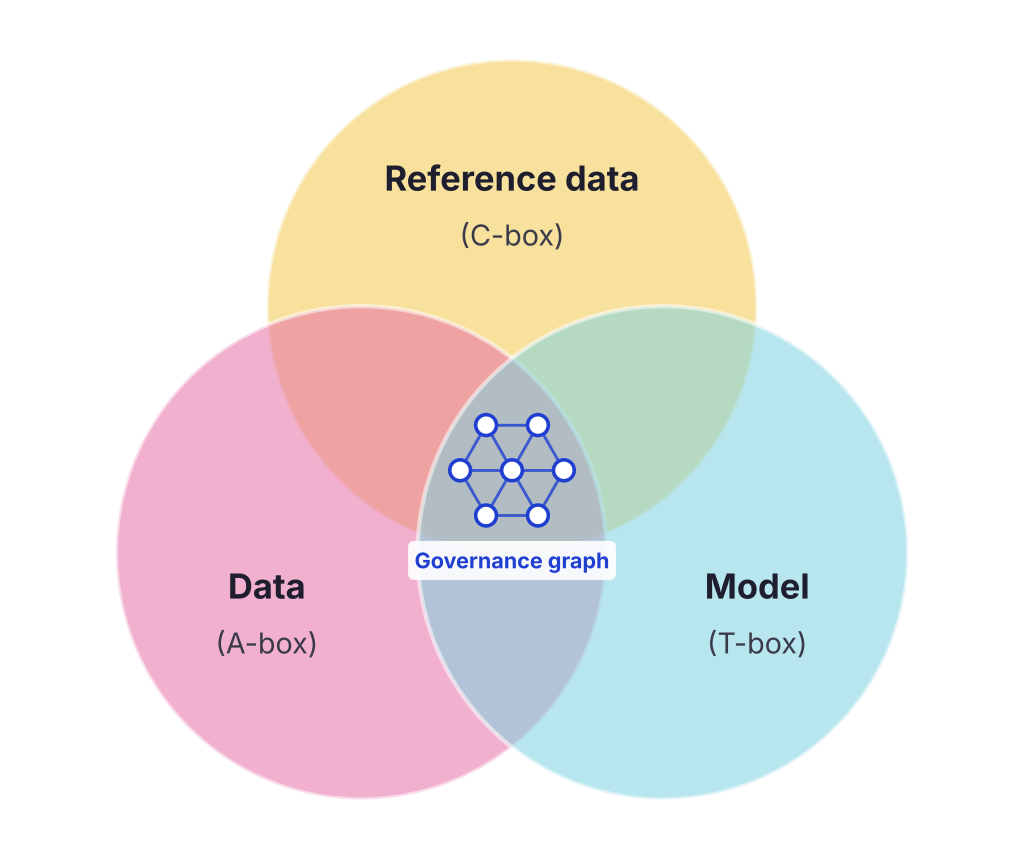
To avoid that, AstraZeneca connects the three parts of its semantic layer in one governance graph:
- The model (T-box): the things that matter to the business and how they relate, like ERA’s ontology in Lesson 3.
- The reference data (C-box): shared identifiers, vocabularies, and rules.
- The data (A-box): catalog records for each data product, down to individual fields.
Because everything is connected, the graph doubles as a health check. It shows how AI-ready each data product is, where quality issues appear, and where curators should focus, since no team has unlimited time for curation. The same graph also gives AI agents their context, so keeping it healthy helps people and machines at once.
AstraZeneca is also “left-shifting,” which means fixing data in the source systems where it’s created instead of cleaning it every time it’s used.
In a nutshell
A semantic backbone is never finished, so plan for its upkeep from day one.
Fix data where it’s created, so you don’t pay for the same fix twice.
Budget for maintenance, not just the build because data can drift with time.
Know where your data lives and who owns it. A data catalog is a good first step.
Let the backbone report its own health, so you know where to spend resources.
There’s much more to it than fits in this blog:
▶ Watch the energy panel to hear why data drifts after the pilot.
▶ Watch the AstraZeneca session to see how a governance graph keeps a growing backbone healthy.
Conclusion
Businesses have unique data. When they use AI, they bring their own systems and needs. Yet the lessons from the Graphwise AI Summit kept pointing to the same fundamental ideas. When the market moves fast and tools pop up like mushrooms, it is those fundamentals that you should rely on.
Guess what? The good news is that you don’t have to learn them the expensive way. Start with one real business problem. Get your content right, connect it through a model of your business, and focus on a single use case. Then keep building on it, and keep it maintained. Step by step, that’s how a promising pilot becomes AI your business can depend on.
Every session in this post goes much deeper than we could cover here, with live demos, real numbers, and audience Q&A.

- Lesson 1: Stop chasing tools
- Lesson 2: Get your content right before you add AI
- Lesson 3: Model the business, not the systems
- In a nutshell
- Lesson 4: Start small, then grow
- In a nutshell
- Lesson 5: Let AI explore and the graph decide
- Let AI draft and the graph find
- Lesson 6: Make your AI show its work
- In a nutshell
- Lesson 7: Your data needs maintenance after the pilot
- In a nutshell
- Conclusion
Details
What is a Knowledge Graph
Knowledge graphs are a collection of interlinked descriptions of entities that put data into context and enable data analytics & sharing.
Learn moreFAQ
Any Questions? Look Here
To scale enterprise AI beyond pilots, organizations must shift from a “data-first” to a “knowledge-first” strategy by establishing a governed semantic backbone, typically an enterprise knowledge graph, that unifies fragmented data silos into an intelligent, queryable asset. This phased approach involves first validating high-impact use cases with proprietary data to prove return on investment (ROI), then operationalizing that foundation with technologies like GraphRAG to ensure large language models provide reliable, explainable, and context-aware outputs. By aligning technical infrastructure with a clear maturity roadmap—such as the Graphwise 5-Star Journey—and securing organizational buy-in through measurable pilot outcomes, enterprises can successfully transition from isolated experiments to a scalable, production-ready intelligence layer that drives continuous business value.
Accountability for an autonomous AI agent’s wrong decision ultimately rests with the organization and the human stakeholders — including developers, legal teams, and business owners — who design and deploy the system. While the AI executes the action, current legal and ethical frameworks treat it as a tool or agent of the deploying entity, which remains liable for its outcomes. To mitigate this risk, enterprises prioritize AI governance and semantic infrastructure to ensure explainability and transparency. By providing a traceable "reasoning path," organizations can audit autonomous decisions and maintain human-in-the-loop oversight as a necessary safeguard for continuous improvement and compliance.
Enterprise data integration remains notoriously difficult because modern tools primarily address technical connectivity — the "plumbing" — while the core challenges are rooted in semantic and organizational complexity. Most enterprise systems were historically built as isolated silos to serve specific business functions, resulting in a fragmented landscape where the same data is defined differently across hundreds of applications. Even with high-speed integration platforms, reconciling these "semantic misalignments" requires a unified understanding of what the data actually means, which is often lost in translation between departments. Furthermore, the sheer variety of data formats (structured, semi-structured, and unstructured) and the persistence of legacy architectures create a convoluted web of dependencies that technical automation alone cannot unravel without a robust, standards-based semantic layer.
Companies can measure the real ROI of AI investments by transitioning from broad enterprise-wide metrics to application-specific KPIs defined at the outset of each project. Tangible value is best demonstrated through significant gains in operational efficiency, such as a 60% reduction in manual data effort or 75% time savings in generating complex reports, alongside measurable improvements in output accuracy—for instance, by leveraging knowledge graphs to reduce AI hallucinations from 15% to 4%. Additionally, tracking "Time-to-Insight" metrics, such as accelerating R&D hypothesis evaluation by 10x or shortening regulatory response times from days to hours, allows organizations to quantify labor cost savings and first-to-market advantages. Utilizing Proof of Value (POV) frameworks ensures these outcomes are validated with proprietary data, providing the concrete evidence needed to justify continued investment and secure executive buy-in
Recommended Content
The Semantic Backbone: The Architecture Behind High-Precision AI Context Platforms
Read about the new industry category Gartner has named: AI Context Platforms. It's something we've already spent years building what it actually requires.
Read more
Moving Beyond the Prototype Plateau: Why Your Agentic AI Needs a Semantic Backbone
Read about how new research from MarketsandMarkets explains how to get beyond the AI pilot stage.
Read more
The 3 Mindsets Shaping Every AI Decision
Read about the three perspectives shaping enterprise AI today and how each approaches its opportunities and risks before putting AI to work.
Read more